That House That’s Been Sitting Could Be Your Best Shot at a Deal

BLOGJune 22, 2026


Open up a home search and you'll see them. Listings that have been on the market for two months. Three. Some longer.

Most buyers scroll right past them, assuming something’s wrong with the house. But that instinct could be costing you, since the longer a home sits, the more motivated the seller usually gets.

Where Some Buyers Are Finding Better Deals

If affordability has been your #1 hurdle to buying, here’s a surprisingly simple strategy that could help you finally get your foot in the door. Start with the homes that have been sitting the longest. That’s often where the best deals are.

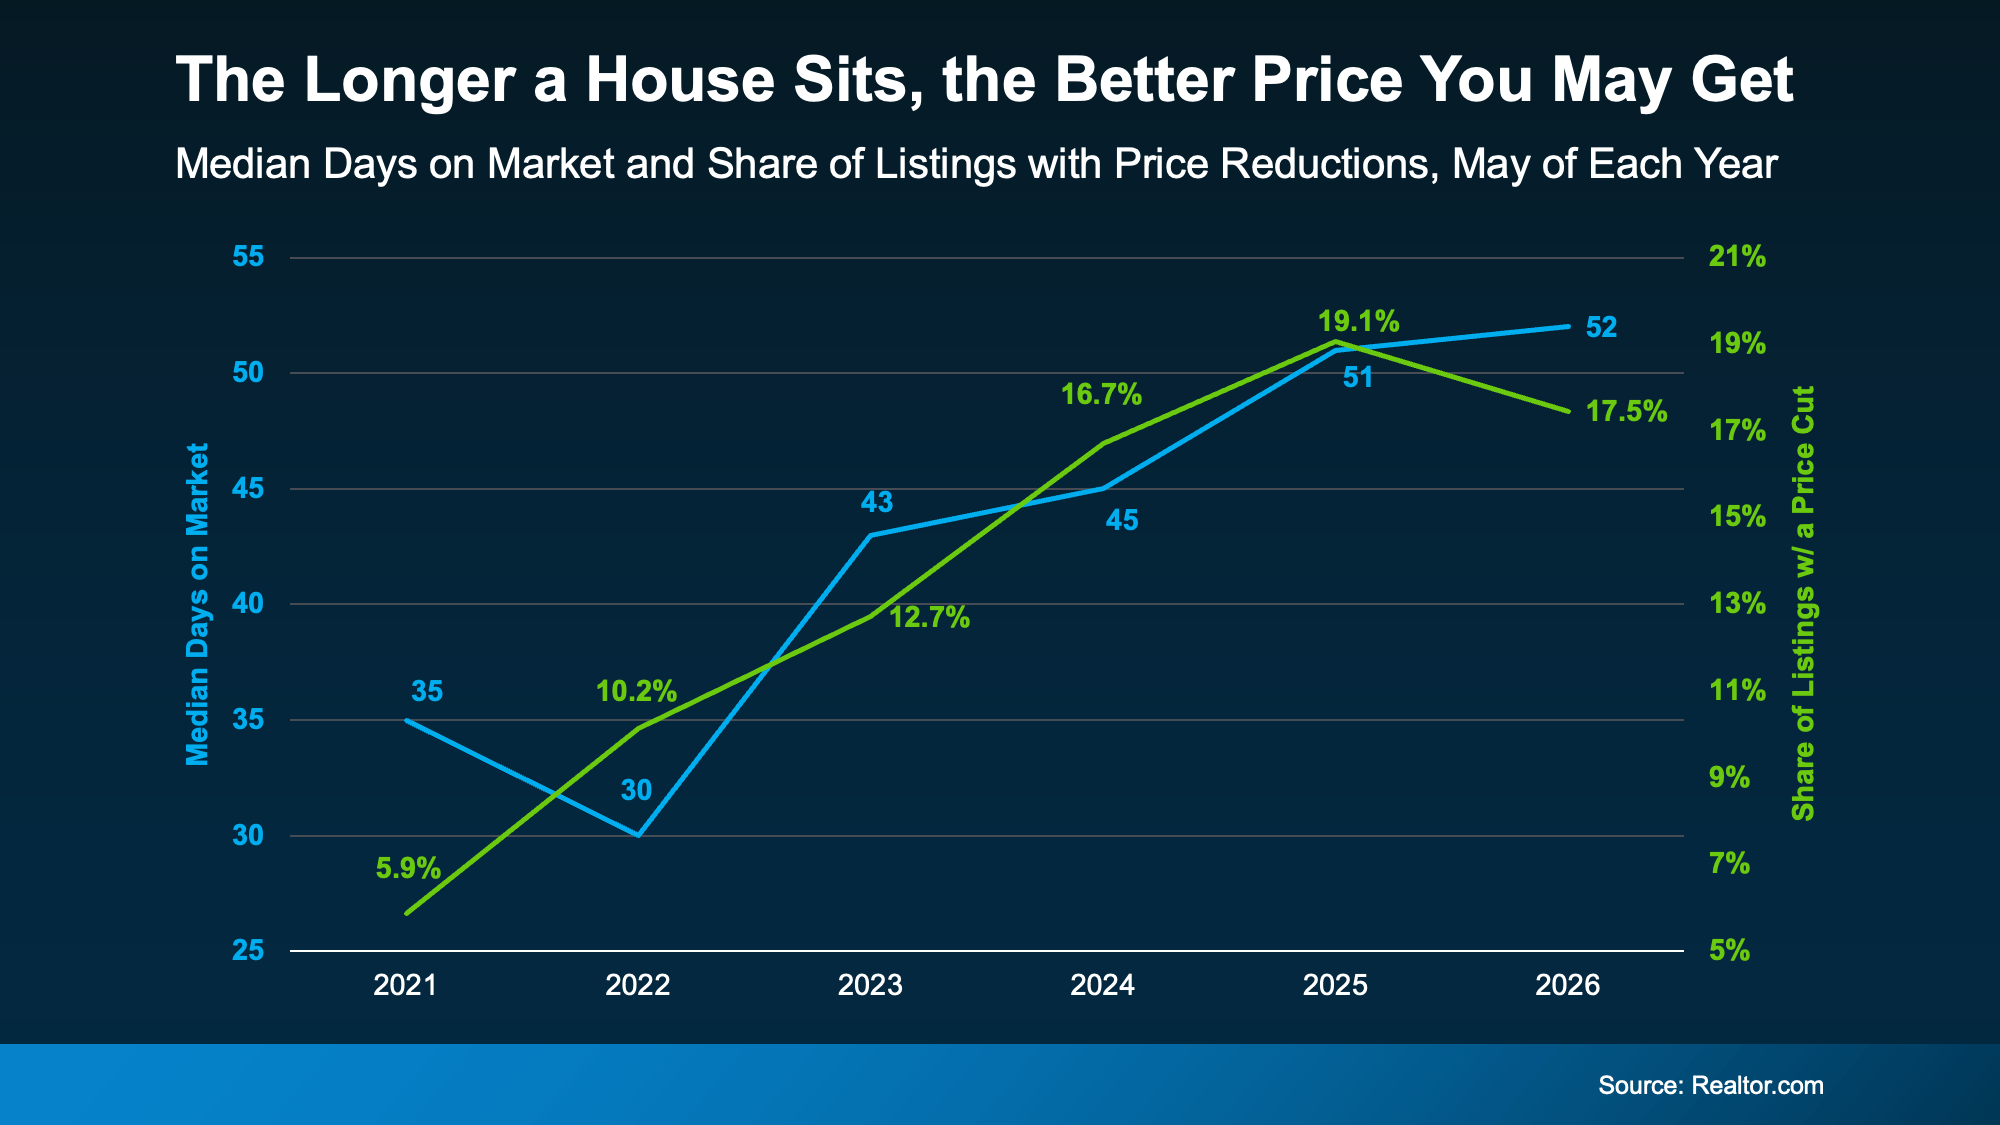
Here’s why. Data from Realtor.com shows there’s a connection between longer time on the market and lower sales prices. Basically, the longer a house sits, the more likely it is that the seller will reduce the price (see graph below):

a graph with numbers and lines

The blue line tracks how long homes stay on the market, while the green line tracks the share of homes getting a price reduction. As one climbs, so does the other.  

And if you focus on these homes that are just sitting and waiting, the opportunity for you is bigger than you may think right now.

Redfin data shows there’s $347 billion worth of stale listings on the market right now – more than ever before for this time of year. So, ask your agent to filter listings for you from oldest to newest. The home that fits your budget might already be there. Just further down the list than you thought.

Lingering Doesn’t Always Mean Something’s Wrong 

Let’s say you do that and something catches your eye. Still, you might be questioning why the home has been sitting in the first place. Just remember, sometimes it has nothing to do with the home itself.

According to Redfin, common causes are:

  • The asking price was set too high to start

  • The home didn’t show well online

  • There are a lot of homes for sale in the area, so it just got buried

So, nothing that’s necessarily a dealbreaker, or even anything that’s wrong with the home itself. If there’s a real issue, a thorough inspection will surface it. And that’s information you can use to negotiate. Not a reason to assume it’s a house worth skipping over.

How To Turn a Lingering Listing into a Win

So how do you capitalize on a lingering listing? According to USA Today, you have two main levers to pull.

The first is price. Work with your agent to study what comparable homes recently sold for, then build an offer around that. Coming in below asking price is fair game when a home has been sitting.

The second is concessions. If a seller won’t budge much on price, they may still help in other ways, like covering some closing costs, repair credits, or even a mortgage rate buydown that lowers your monthly payment.

A local agent has the context to tell which homes are the real opportunities and which are skippable.

Bottom Line

A house sitting on the market isn’t always a glaring red flag. In today’s market, it may be your best opportunity yet.

For help deciding which lingering listings are actually worth a second look, let’s connect.

The information contained, and the opinions expressed, in this article are not intended to be construed as investment advice. Keeping Current Matters, Inc. does not guarantee or warrant the accuracy or completeness of the information or opinions contained herein. Nothing herein should be construed as investment advice. You should always conduct your own research and due diligence and obtain professional advice before making any investment decision. Keeping Current Matters, Inc. will not be liable for any loss or damage caused by your reliance on the information or opinions contained herein.

Sept. 23, 2020

Home Builder Confidence Hits All-Time Record?

Home Builder Confidence Hits All-Time Record

Home Builder Confidence Hits
All-Time Record | MyKCM

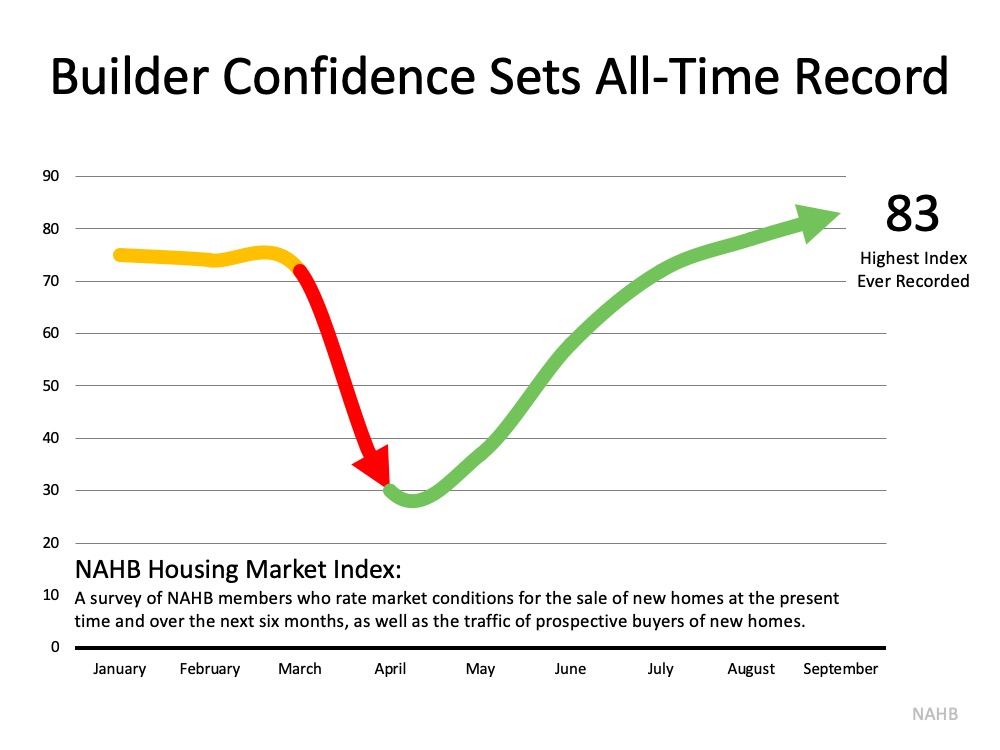
Last week, the National Association of Home Builders (NAHB) reported their Housing Market Index (HMI) hit an all-time high in the 35-year history of the series with a score of 83. The index gauges builder perceptions of current single-family home sales and sale expectations for the next six months, as well as the traffic of prospective buyers of new homes.

As the following chart shows, confidence dropped dramatically when stay-in-place orders were originally mandated earlier this year. Since then, it has soared back.Home
Builder Confidence Hits All-Time Record | MyKCMLooking at the three-month moving averages for HMI scores, confidence increased in every region of the country:

  • The Northeast increased 11 points to 76
  • The Midwest jumped 9 points to 72
  • The South rose 8 points to 79
  • The West increased 7 points to 85

Confidence Is Validated by the Numbers

This confidence is definitely warranted. According to a recent NAHB report, single-family housing starts increased 4.1% to a 1.02 million annual rate, and single-family permits increased 6% to a 1.04 million unit rate, meaning newly constructed homes are on the rise.

A separate report from the Mortgage Bankers Association (MBA) shows mortgage applications for new home purchases increased by 33.3% compared to a year ago. Joel Kan, Associate Vice President of Economic and Industry Forecasting at MBA, commented on the numbers:

“The housing market continued to exceed expectations in August, as housing demand for new homes stayed strong and the job market continued to recover…The new home market has maintained its path of recovery throughout the summer, and record-low mortgage rates and households seeking more space will likely continue to drive demand into the fall.”

Bottom Line

If you're thinking about putting your house on the market but are afraid you may not find a home to buy, let's connect to discuss new construction opportunities in our area.
 

Posted in Market Updates
Sept. 22, 2020

The Cost of a Home Is Far More Important than the Price?

The Cost of a Home Is Far More Important than the Price

The Cost of a Home Is Far
More Important than the Price | MyKCM

Housing inventory is at an all-time low. There are 39% fewer homes for sale today than at this time last year, and buyer demand continues to set records. Zillow recently reported:

Newly pending sales are up 25.5% compared to the same week last year, the highest year-over-year increase in the weekly Zillow database.

Whenever there is a shortage in supply of an item that's in high demand, the price of that item increases. That's exactly what's happening in the real estate market right now. CoreLogic's latest Home Price Index reports that values have increased by 5.5% over the last year.

This is great news if you're planning to sell your house; on the other hand, as either a first-time or repeat buyer, this may instead seem like troubling news. However, purchasers should realize that the price of a house is not as important as the cost. Let's break it down.

There are several factors that influence the cost of a home. The two major ones are the price of the home and the interest rate at which a buyer can borrow the funds necessary to purchase the home.

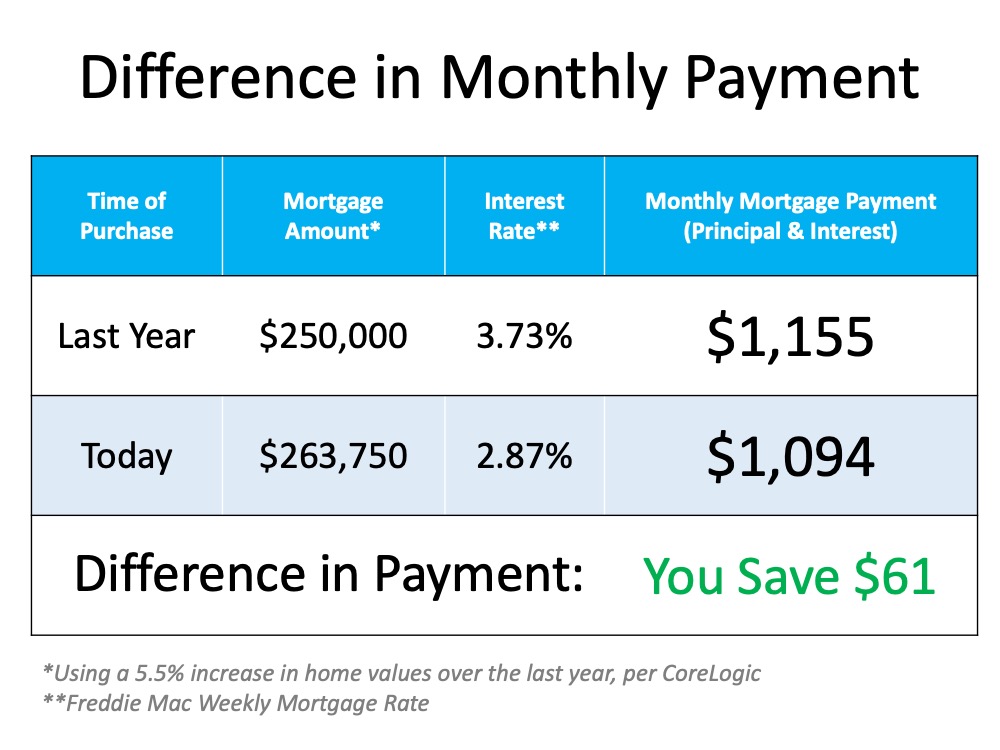
Last week, Freddie Mac announced that the average interest rate for a 30-year fixed-rate mortgage was 2.87%. At this time last year, the rate was 3.73%. Let's use an example to see how that difference impacts the true cost of a home.

Assume you purchased a home last year and took out a $250,000 mortgage. As mentioned above, home values have increased by 5.5% over the last year. To buy that same home this year, you would need to take out a mortgage of $263,750.

How will your monthly mortgage payment change based on today's lower mortgage rate?

This table calculates the difference in your monthly payment:The
Cost of a Home Is Far More Important than the Price | MyKCMThat's a savings of $61 monthly, which adds up to $732 annually and $21,960 over the life of the loan.

Bottom Line

Even though home values have appreciated, it's a great time to buy a home because mortgage rates are at historic lows.

Posted in Market Updates
Sept. 21, 2020

Is the Economic Recovery Beating All Projections?

Is the Economic Recovery Beating All Projections?

Is the Economic Recovery
Beating All Projections? | MyKCM

Earlier this year, many economists and market analysts were predicting an apocalyptic financial downturn that would potentially rattle the U.S. economy for years to come. They immediately started to compare it to the Great Depression of a century ago. Six months later, the economy is still trying to stabilize, but it is evident that the country will not face the total devastation projected by some. As we continue to battle the pandemic, forecasts are now being revised upward. The Wall Street Journal (WSJ) just reported:

The U.S. economy and labor market are recovering from the coronavirus-related downturn more quickly than previously expected, economists said in a monthly survey.

Business and academic economists polled by The Wall Street Journal expect gross domestic product to increase at an annualized rate of 23.9% in the third quarter. That is up sharply from an expectation of an 18.3% growth rate in the previous survey.

What Shape Will the Recovery Take?

Economists have historically cast economic recoveries in the form of one of four letters – V, U, W, or L.

V-shaped recovery is all about the speed of the recovery. This quick recovery is treated as the best-case scenario for any economy that enters a recession. NOTE: Economists are now also using a new term for this type of recovery called the Nike Swoosh. It is a form of the V-shape that may take several months to recover, thus resembling the Nike Swoosh logo.

U-shaped recovery is when the economy experiences a sharp fall into a recession, like the V-shaped scenario. In this case, however, the economy remains depressed for a longer period of time, possibly several years, before growth starts to pick back up again.

W-shaped recovery can look like an economy is undergoing a V-shaped recovery until it plunges into a second, often smaller, contraction before fully recovering to pre-recession levels.

An L-shaped recovery is seen as the worst-case scenario. Although the economy returns to growth, it is at a much lower base than pre-recession levels, which means it takes significantly longer to fully recover.

Many experts predicted that this would be a dreaded L-shaped recovery, like the 2008 recession that followed the housing market collapse. Fortunately, that does not seem to be the case.

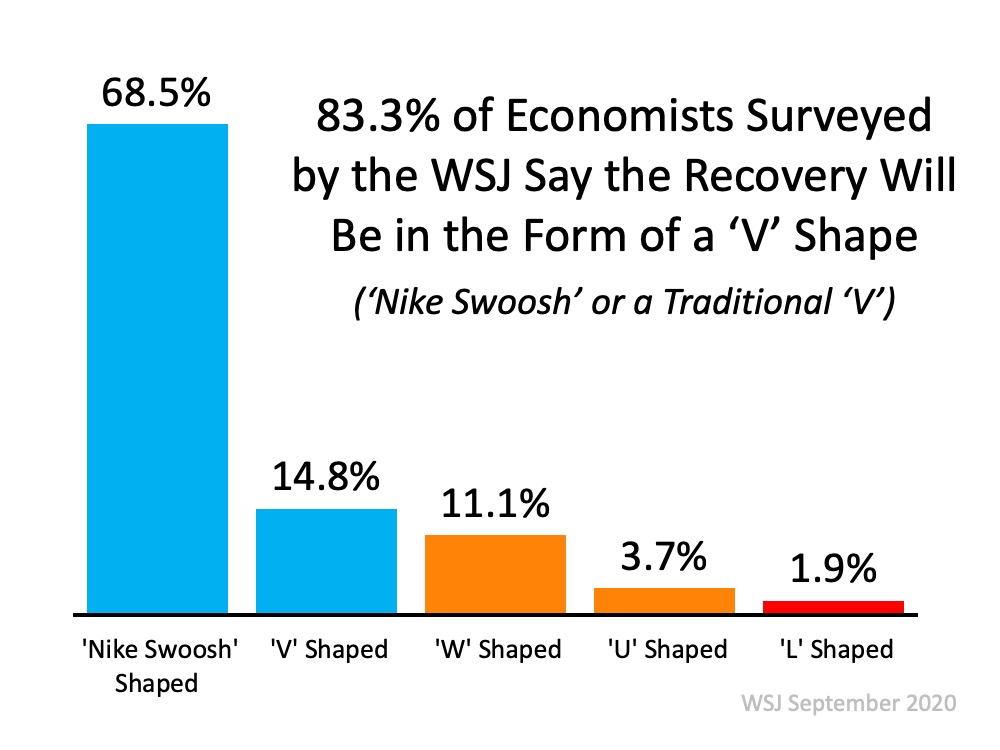
The same WSJ survey mentioned above asked the economists which letter this recovery will most resemble. Here are the results:Is
the Economic Recovery Beating All Projections? | MyKCM

What About the Unemployment Numbers?

It's difficult to speak positively about a jobs report that shows millions of Americans are still out of work. However, when we compare it to many forecasts from earlier this year, the numbers are much better than most experts expected. There was talk of numbers that would rival the Great Depression when the nation suffered through four consecutive years of unemployment over 20%.

The first report after the 2020 shutdown did show a 14.7% unemployment rate, but much to the surprise of many analysts, the rate has decreased each of the last three months and is now in the single digits (8.4%).

Economist Jason Furman, Professor at Harvard University‘s John F. Kennedy School of Government and the Chair of the Council of Economic Advisers during the previous administration, recently put it into context:

An unemployment rate of 8.4% is much lower than most anyone would have thought it a few months ago. It is still a bad recession but not a historically unprecedented event or one we need to go back to the Great Depression for comparison.

The economists surveyed by the WSJ also forecasted unemployment rates going forward:

  • 2021: 6.3%
  • 2022: 5.2%
  • 2023: 4.9%

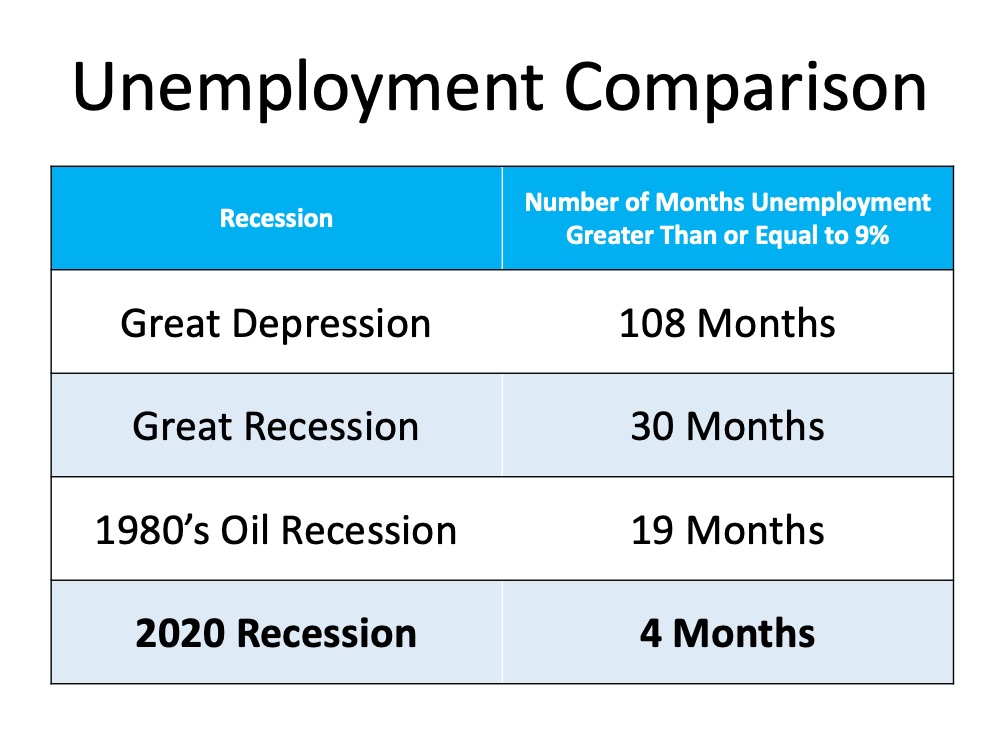
The following table shows how the current employment situation compares to other major disruptions in our economy:Is
the Economic Recovery Beating All Projections? | MyKCM

Bottom Line

The economic recovery still has a long way to go. So far, we are doing much better than most thought would be possible.

Posted in Market Updates
Sept. 18, 2020

?Homes Across the Country Are Selling Fast [INFOGRAPHIC]

Homes Across the Country Are Selling Fast [INFOGRAPHIC]

Homes Across the Country Are
Selling Fast [INFOGRAPHIC] | My KCM

Some Highlights

  • Buyers are actively searching for and purchasing homes at a record-breaking pace. According to the latest report from the National Association of Realtors (NAR), in July, 68% of homes were on the market for less than a month.
  • With homes moving from listing day to pending sale in an average of just 22 days, it's a great time to sell a house.
  • Let's connect today so you can make your move while buyers are scooping homes up faster than they're coming to market.
Posted in Market Updates
Sept. 17, 2020

How Low Inventory May Impact the Housing Market This Fall?

How Low Inventory May Impact the Housing Market This Fall

How Low Inventory May Impact
the Housing Market This Fall | MyKCM

Real estate continues to be called the ‘bright spot' in the current economy, but there's one thing that may hold the housing market back from achieving its full potential this year: the lack of homes for sale.

Buyers are actively searching for and purchasing homes, looking to capitalize on today's historically low interest rates, but there just aren't enough houses for sale to meet that growing need. Sam Khater, Chief Economist at Freddie Mac, explains:

Mortgage rates have hit another record low due to a late summer slowdown in the economic recovery…These low rates have ignited robust purchase demand activity…However, heading into the fall it will be difficult to sustain the growth momentum in purchases because the lack of supply is already exhibiting a constraint on sales activity.

According to the National Association of Realtors (NAR), right now, unsold inventory sits at a 3.1-month supply at the current sales pace. To have a balanced market where there are enough homes for sale to meet buyer demand, the market needs inventory for 6 months. Today, we're nowhere near where that number needs to be. If the trend continues, it will get even harder to find homes to purchase this fall, and that may slow down potential buyers. Danielle Hale, Chief Economist at realtor.comnotes:

The overall lack of sustained new listings growth could put a dent in fall home sales despite high interest from home shoppers, because new listings are key to home sales.

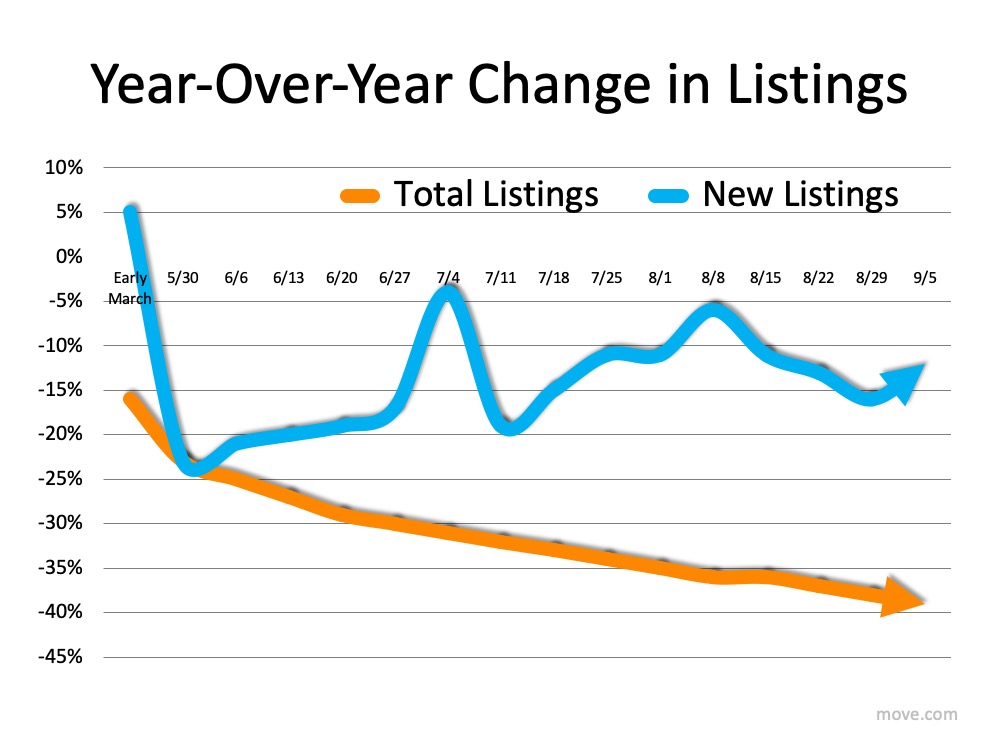
The realtor.com Weekly Recovery Report keeps an eye on the number of listings coming into the market (houses available for sale) and the total number of listings staying in the market compared to the previous year (See graph below):How
Low Inventory May Impact the Housing Market This Fall | MyKCMBuyers are clearly scooping up homes faster than they're being put up for sale. The number of total listings (the orange line) continues to decline even as new listings (the blue line) are coming to the market. Why? Javier Vivas, Director of Economic Research at realtor.comnotes:

The post-pandemic period has brought a record number of homebuyers back into the market, but it's also failed to bring a consistent number of sellers back. Homes are selling faster, and sales are still on an upward trend, but rapidly disappearing inventory also means more home shoppers are being priced out. If we don't see material improvement to supply in the next few weeks, we could see the number of transactions begin to dwindle again even as the lineup of buyers continues to grow.

Does this mean it's a good time to sell?

Yes. If you're thinking about selling your house, this fall is a great time to make it happen. There are plenty of buyers looking for homes to purchase because they want to take advantage of low interest rates. Realtors are also reporting an average of 3 offers per house and an increase in bidding wars, meaning the demand is there and the opportunity to sell for the most favorable terms is in your favor as a seller.

Bottom Line

If you're considering selling your house, this is the perfect time to connect so we can talk about how you can benefit from the market trends in our local area.

Posted in Market Updates
Sept. 15, 2020

Is Now a Good Time to Move?


Is Now a Good Time to Move?

Is Now a Good Time to Move? |
MyKCM

How long have you lived in your current home? If it's been a while, you may be thinking about moving. According to the latest Profile of Home Buyers and Sellers by the National Association of Realtors (NAR), in 2019, homeowners were living in their homes for an average of 10 years. That's a long time to time to be in one place, considering the average length of time homeowners used to stay put hovered closer to 6 years.

With today's changing homebuyer needs, especially given how the current health crisis has altered our daily lifestyles, many homeowners are reconsidering where they're at and thinking about moving to a home with more space for their families. Here's why it might be a great time to make that happen.

The real estate market has changed in many ways over the past 10 years, and current homeowners are earning much more equity today than they used to have. According to CoreLogic, in the first quarter of 2020 alone, the average homeowner gained approximately $9,600 in equity. If you're considering selling your house right now, you may have accumulated more equity to put toward a move than you realize.

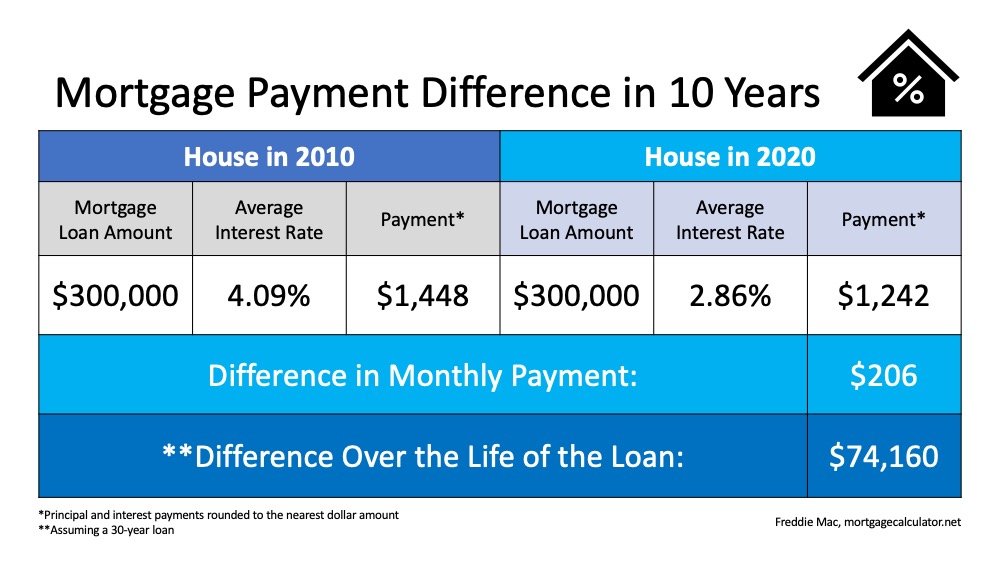
Dialing back 10 years, many homeowners also locked in a fairly low mortgage rate. In 2010, the average rate was only 4.09%. This motivated homeowners to stay in their houses longer than usual to keep their rate low, rather than moving. Just last Thursday, however, average mortgage rates hit a new historic low at 2.86%. Sam Khater, Chief Economist at Freddie Mac explains:

Mortgage rates have hit another record low due to a late summer slowdown in the economic recovery…These low rates have ignited robust purchase demand activity, which is up twenty-five percent from a year ago and has been growing at double digit rates for four consecutive months.

Ten years ago, we couldn't have imagined a mortgage rate under 3%. Looking at the math today, making a move into a new home and locking in a significantly lower rate than you have now could save you greatly on a monthly basis, and over the life of your loan (See chart below):Is
Now a Good Time to Move? | MyKCMAs the example shows, you can save a substantial amount every month if you qualify for today's low mortgage rate, and the savings can really add up over the life of a 30-year fixed-rate loan.

Bottom Line

As a homeowner, you have a huge opportunity to move up right now. Whether you want to save more each month or get more home for your money based on your family's changing needs, it's a great time to connect to discuss the market in our area. Buyers are actively looking for more homes to buy, and you can win big by making a move if the time is right for you.

Posted in Market Updates
Sept. 14, 2020

Two New Surveys Indicate Urban to Suburban Lean?

Two New Surveys Indicate Urban to Suburban Lean

Two New Surveys Indicate
Urban to Suburban Lean | MyKCM

There has been much talk around the possibility that Americans are feeling less enamored with the benefits of living in a large city and now may be longing for the open spaces that suburban and rural areas provide.

In a recent Realtor Magazine article, they discussed the issue and addressed comments made by Lawrence Yun, Chief Economist for the National Association of Realtors (NAR):

While migration trends were toward urban centers before the pandemic, real estate thought leaders have predicted a suburban resurgence as home buyers seek more space for social distancing. Now the data is supporting that theory. Coronavirus and work-from-home flexibility is sparking the trend reversal, Yun said. More first-time home buyers and minorities have also been looking to the suburbs for affordability, he added.

NAR surveyed agents across the country asking them to best describe the locations where their clients are looking for homes (they could check multiple answers). Here are the results of the survey:

  • 47% suburban/subdivision
  • 39% rural area
  • 25% small town
  • 14% urban area/central city
  • 13% resort community/recreational area

According to real estate agents, there's a strong preference for less populated locations such as suburban and rural areas.

Real Estate Brokers and Owners Agree

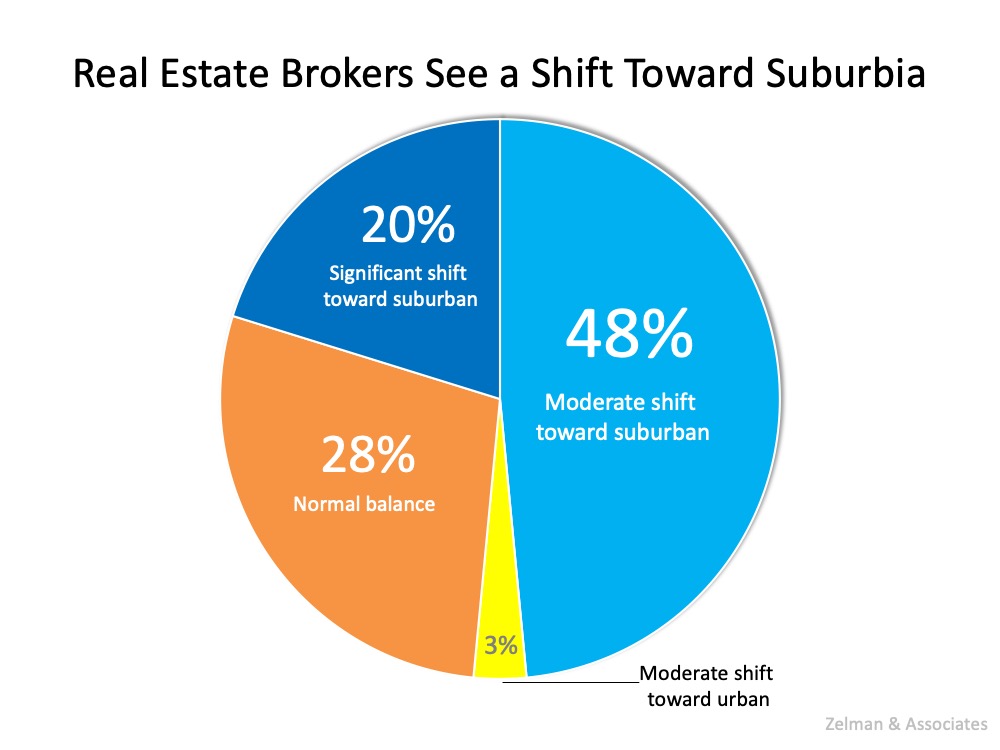
Zelman & Associates surveys brokers and owners of real estate firms for their monthly Real Estate Brokers Report. The last report revealed that 68% see either a ‘moderate' or ‘significant' shift to more suburban locations. Here are the results of the survey:Two
New Surveys Indicate Urban to Suburban Lean | MyKCM

Bottom Line

No one knows if this will be a short-term trend or an industry game-changer. For now, there appears to be a migration to more open environments.

Posted in Market Updates
Sept. 11, 2020

?Virtual School Is Changing Homebuyer Needs [INFOGRAPHIC]

Virtual School Is Changing Homebuyer Needs [INFOGRAPHIC]

Virtual School Is Changing
Homebuyer Needs [INFOGRAPHIC] | My KCM

Some Highlights

  • With remote learning sweeping the nation this academic year, organized spaces with enough room for kids to learn effectively are high on buyer wish lists.
  • If you're trying to make room for your family's growing needs, multi-purpose rooms and dedicated workspaces may be features to consider in your next home.
  • Let's connect today so you can find a home where your kids feel confident and comfortable too.
Posted in Market Updates
Sept. 10, 2020

Homebuyer Traffic Is on the Rise?

Homebuyer Traffic Is on the Rise

Homebuyer Traffic Is on the
Rise | MyKCM

One of the biggest surprises of 2020 is the resilience of the residential real estate market. Lawrence Yun, Chief Economist of the National Association of Realtors (NAR), is now forecasting that more homes will sell this year than last year. He's also predicting home sales to increase by 8-12% next year. There's strong evidence that he will be right.

ShowingTime, a leading showing software and market stat service provider for the residential real estate industry, just reported on their latest the ShowingTime Showing Index:

Home buyer traffic jumped again in July, recording a 60.7 percent year-over-year increase in nationwide showing activity.

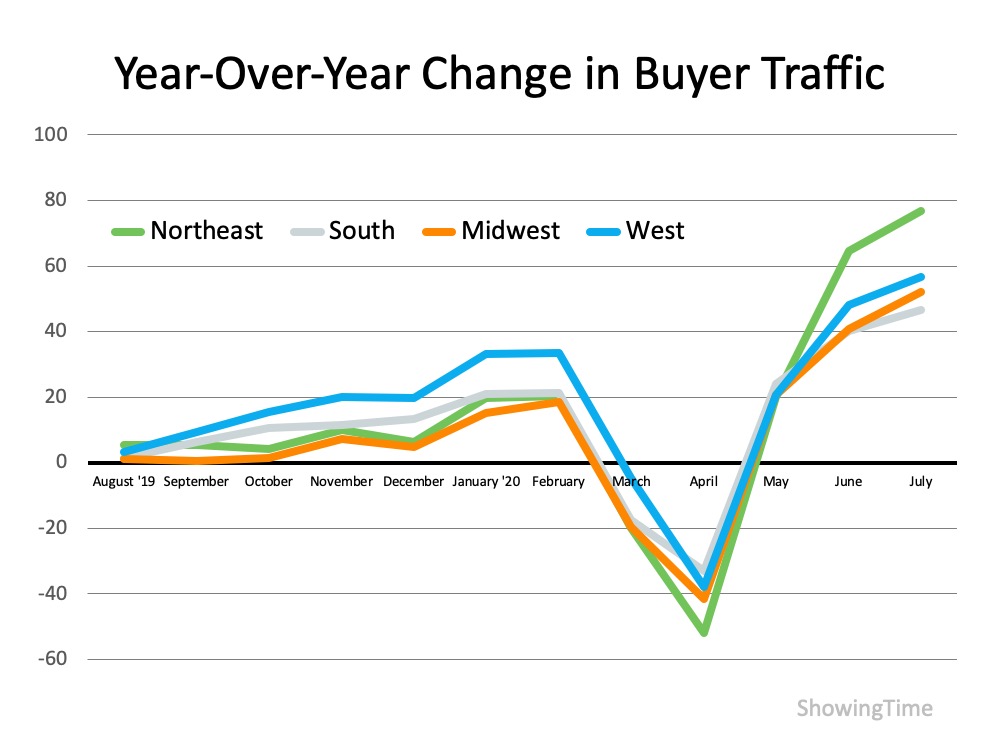
That means there are 60% more buyers setting appointments to see homes than there were at this same time last year. The number of potential purchasers was also up dramatically in every region of the country:

  • The Northeast was up 76.6%
  • The West was up 56.7%
  • The Midwest was up 52.1%
  • The South was up 46.7%

The Housing Market Is Showing a ‘V' Type Recovery

ShowingTime also indicates the real estate market has already come back from the downturn earlier this year that was caused by shelter-in-place orders. Here are the year-over-year numbers for each region on a monthly basis (See graph below):Homebuyer Traffic Is on the Rise | MyKCMWe're way ahead of where we were at this time last year. This data validates the thoughts of Frank Martell, President and CEO of CoreLogic, who recently noted:

On an aggregated level, the housing economy remains rock solid despite the shock and awe of the pandemic.

Bottom Line

If you're thinking about selling your house, this may be a great time to get the best price and the most favorable terms.

Posted in Market Updates
Sept. 9, 2020

The Latest Unemployment Rate Fell to 8.4%?

The Latest Unemployment Rate Fell to 8.4%

The Latest Unemployment Rate
Fell to 8.4% | MyKCM

Last Friday, the Bureau for Labor Statistics released their Employment Report for August 2020. The big surprise was that the unemployment rate fell to 8.4%, a full percent lower than what many analysts had forecasted earlier in the week. Though it is tough to look at this as great news when millions of Americans are still without work, the number of unemployed is currently much lower than most experts had projected it would be just a few months ago.

Not Like the Great Depression or Even the Great Recession

Jason Furman, Professor of Practice at Harvard explained:

An unemployment rate of 8.4% is much lower than most anyone would have thought it a few months ago. It is still a bad recession but not a historically unprecedented event or one we need to go back to the Great Depression for comparison.

During the Great Depression, the unemployment rate was over 20% for four consecutive years (1932 – 1935). This April, the rate jumped to 14.7%, but has fallen each month since.

During and after the Great Recession (2007-2009), the unemployment rate was at 9% or greater for thirty consecutive months (April 2009 – October 2011). Most economists believe the current rate will continue to fall monthly as the economy regains its strength.

What Happens Going Forward?

The outcome will be determined by how quickly we can contain the virus. In their last Economic Forecasting Survey, the Wall Street Journal reported the economists surveyed believe the annual unemployment rates will be 6.6% in 2021 and 5.5% in 2022. Though that will still be greater than the 3.5% rate that we saw earlier this year, it is lower than the annual rate reported in 2011 (8.5%), 2012 (7.9%), and 2013 (6.7%).

Bottom Line

There are still millions of Americans struggling through this economic downturn. There is, however, light at the end of the tunnel. The unemployment situation did not get as bad as many had predicted, and the recovery is taking place faster than most thought would happen.


Posted in Market Updates